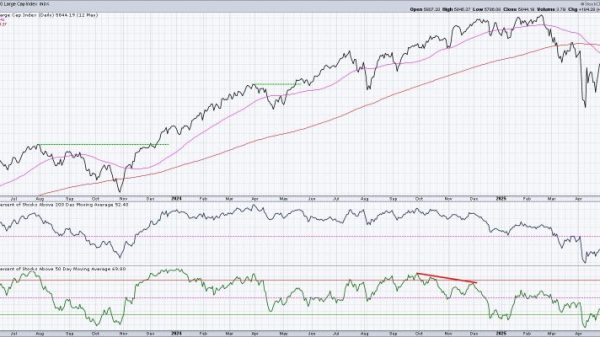
Want to know how to find strong stocks in a volatile market? In this video, Joe uses Relative Strength (RS), Fibonacci retracements, and technical analysis to spot top sectors and manage downside risk.
Follow along as Joe breaks down how to use the Relative Strength indicator to separate outperforming stocks from those failing at resistance. He highlights sectors showing strong or improving RS, discusses the Fibonacci retracement on QQQ, and explains what it means for downside risk.
Joe wraps up with detailed chart analysis on viewer-submitted symbol requests, including QTUM, HOOD, and more, to help you sharpen your trading decisions with expert insights.
The video premiered on May 14, 2025. Click this link to watch on Joe’s dedicated page.
Archived videos from Joe are available at this link. Send symbol requests to stocktalk@stockcharts.com; you can also submit a request in the comments section below the video on YouTube. Symbol Requests can be sent in throughout the week prior to the next show.


